UK CPI Leaps Again, But Some Signs Of Peaking
UK CPI data from Wednesday 22nd June hit another new 40 year high at 9.1%. However, the number was in line with consensus expectation, whilst month-on-month data was at 0.7% for May, above forecasts of 0.6%, but notably below the 2.5% monthly increase in April. Is this signalling a possible peak?
With UK inflation data possibly a lead indicator of global price pressures, this could be seen as a bigger positive. In addition, global Bond markets (notable in the US) are signalling a possible short-term yield top, which could encourage a better stock index recovery.
UK inflation has reached an all-time high, with consumer prices reaching 9.1% in May. This is up from April's rate of 9.0%, but in line with economist forecasts. The jump comes as food and fuel continue to skyrocket due to the energy crisis brought about by the conflict in Ukraine and wider supply chain issues in the post-pandemic world.
The month-on-month data printed at 0.7% for May, which although was higher than the consensus of 0.6%, was considerably lower than April’s 2.5% monthly rise. Furthermore, another possible positive for the UK economy and the fight against inflation was the modest fall in Core CPI, which is a measure that excludes food, fuel, alcoholic drinks and tobacco.
The Bank of England closely watches this indicator at not only did it fall back slightly last month, from 6.2% to 5.9%, but this was also below the consensus forecast of 6.0%.
Clearly, this data is far from positive and will grab negative headlines because of the leap to a 40 year high for the headline number, but there are some small positives to be picked from the data and possible signals that UK inflation could be moving closer towards a peak.
UK Data Appears To Be Leading Global Inflation Reading
After their meeting last week, the Bank of England stated that inflation was on track to reach 11% this year, in the wake of soaring gas and electricity prices, plus surging food and drink prices. And remember of the world’s major central banks, the Bank of England started their rate hike cycle first, with the first rise back in December 2021. It could be argued that the high levels of inflation being seen in the UK and the path of UK inflation from 2021 could be seen as a leading indicator of inflation across the globe.
If this is the case, then the possible positives seen in the UK May inflation report, as we have outlined above, could be a signal of global inflationary pressures beginning to peak.
Potential Turning Point Signaled by Post-Fed Bond And Stock Indices Divergent
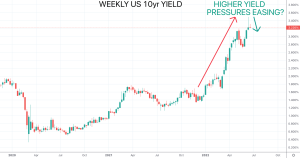
Since the Fed hiked rates by 0.75% last week (on Wednesday 15th June), there has been divergent price activity in US (and global) Government Bond and equity indices. Throughout 2022, higher yield pressures across global Bond markets (driven by higher inflation and hawkish central banks) have been correlated with significant losses across global stock averages.
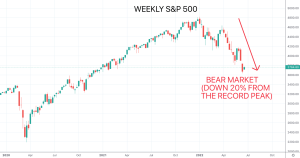
Since last Wednesday, however, global bond markets have rebounded to lower yields, whilst equity markets initially continued their downward path last week. This saw the S&P 500 last week post its worst week since March 2020 and move into bear market territory, down over 20% from the early 12022 record high.

This divergent activity may be signalling a possible end to negative pressures for stock markets, at least in the short-term, as bond markets signal a possible move to lower yields.
 Author: Mr. Steve Miley ~ Sr. Investment Advisor


