

Yield Curves and a Possible UK Recession
July 25 2023
The yield curve is generally considered to be the number 1 indicator in predicting a recession. By definition, it tracks interest rates across different time periods, from one month to 30 years, and the slope of the curve helps predict future interest rate changes and economic activity.
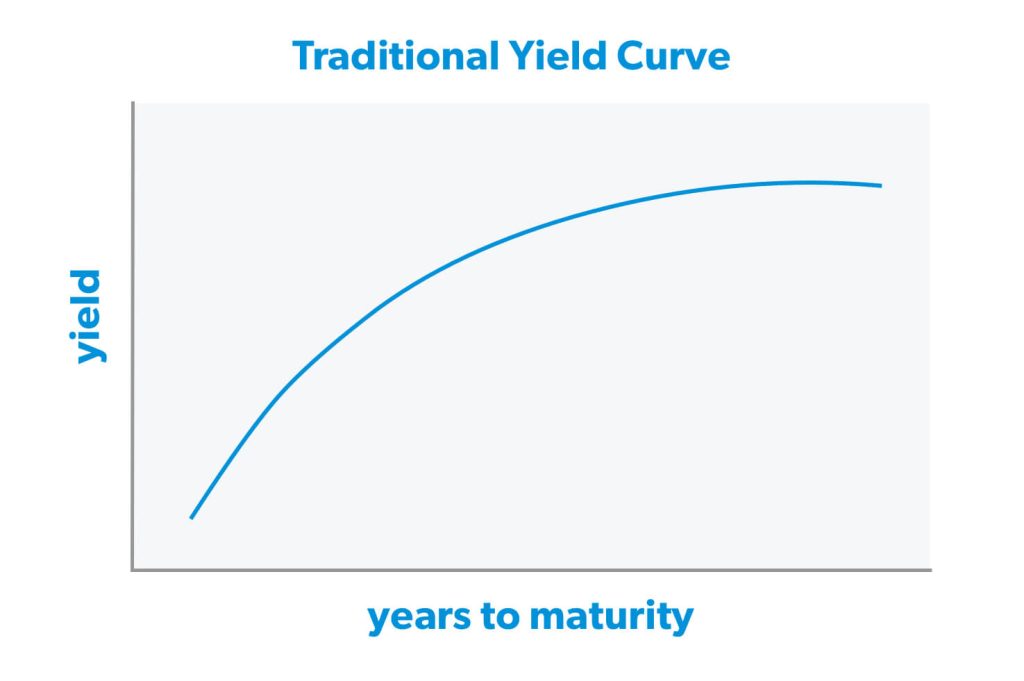
It is known that the longer you borrow money on a loan, the higher the interest rate will be, therefore you have a yield curve sloping upwards, however in the current UK climate, we have a downward sloping yield curve, commonly known as an inverted yield curve. We have an unusual situation in the UK market where short-term interest rates are exceeding long term rates. The last 10 times this has happened, we have had a recession!
“Historically, a US recession tends to follow a year after the curve inverts, though the variance is large, and there are occasional false positives” said Priya Misra, head of Global Rates strategy at TD securities. However, what is the situation in the UK?
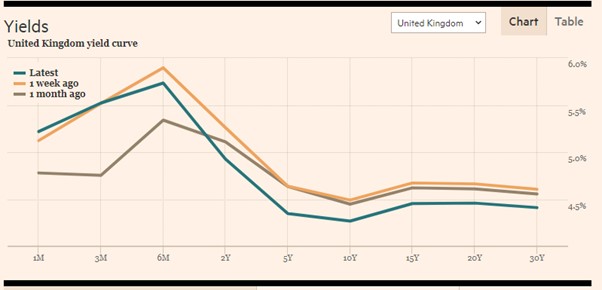
Source: Financial Times, Markets
If you were to analyse the last 10 recessions, timing it from the exact time that the yield curve inverts to the official confirmation of a recession, the shortest time it took was 4 months during the 1960s recession, and the longest time it took was 16 months for the massive 2008 recession. On average, it takes 9 months from the point the yield curve inverts to the official confirmation of a recession; and on July 18th 2023, it officially is 9 months.
There was a consensus at the end of last year that interest rates had peaked, and we would have a recession where rates began to fall, however 7 months on, the predictions were completely wrong. We know a recession will happen; however, it looks to be closer to the 16 months’ time span above. Rates will continue to climb the longer a recession does not occur, until it finally happens.
Author: Joshua Clement