
BFL Focus: Technical Outlook and Sector Overviews of the UK Stock Market
August 10 2022
Where To Next For UK Stocks And The FTSE 100?
In this article we are going to look at the prospects for the FTSE 100 into the balance of the third quarter and onto year in 2022. The UK benchmark index has been relatively a performer compared to its European and US counterparts throughout this year, dropping less from its multiyear peak set in February, and positing strong rebound from mid-July after a base was formed throughout June.
This solid performance has been assisted by a relatively robust financial sector, as UK and global interest rates have risen, usually a positive for financial stocks and particularly banks. Plus, by a strong performance by the energy sector, which has benefited from surging energy prices in the wake of the conflict in Ukraine.
FTSE 100 Technical Outlook
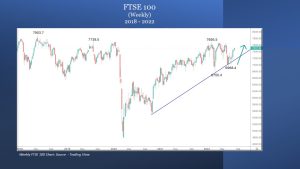
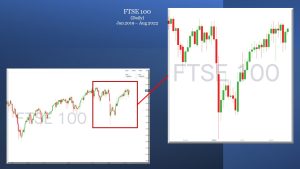
The FTSE 100 has posted a strong rebound since a low was established to the current bear market correction in late June at 6968.4. Notably, this low was above the low posted earlier this year in March, after the conflict Ukraine began, at 6755.4. Furthermore, from a technical analysis perspective, the market held at the up trend line, which is drawn off of the October 2020 and March 2022 swing lows, during the correction lower in June.
The UK benchmark index has added over 8% since the rebound from the June low and is now less than 3% from the 2022 peak at 7695.5. Moreover, just above that peak sees the 2019 high at 7738.5, then the record high from May 201 is not too far above, currently just over 5% away at 7903.7.
We see the strong risk for the balance of Q3 (by end of September but likely in August) to test 7695.5 and 7738.5, with the year-end threat for a new record level above 7903.7.
UK Sectors Overview
Energy Sector Overview
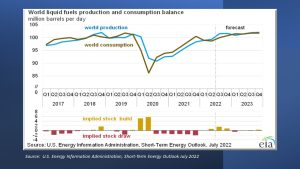
The COVID-19 pandemic response has caused more than two years of price volatility in the global oil markets, and Russia's full-scale invasion of Ukraine has increased market uncertainty and volatility in 2022. Since mid-2020, the world's oil consumption has outpaced the world's oil supply, combined with the heightened possibility that the world's oil supply could be limited—has significantly increased the price of both crude oil and petroleum products. Commercial oil inventories in the OECD have dropped outside of their five-year (2017-2021) range and are close to their lowest levels since 2014. This is because production has not kept up with demand. More detail are available here.
Best performing energy stocks from the Energy Select Sector SPDR Fund ETF (XLE) year to date (July 29th, 2022)
Company (Ticker) |
Performance Year to Date (%) |
| Occidental Petroleum (OXY) | 126.8% |
| Coterra Energy (CTRA) | 61.0% |
| ExxonMobil (XOM) | 58.4% |
| Hess (HES) | 51.9% |
| Marathon Oil (MRO) | 51.0% |
| Valero Energy (VLO) | 47.5% |
| Marathon Petroleum (MPC) | 43.2% |
| Devon Energy (DVN) | 42.7% |
| Chevron (CVX) | 39.6% |
| APA (APA) | 38.2% |
The year has been extremely positive for oil and gas stocks, with Occidental Petroleum performing at 126.8%. However, the high volatility of this sector makes it very difficult to speculate whether this high performance will continue this year and next year.
We will now focus on two of the largest energy companies on the FTSE 100, Shell, and BP.
Shell performance
Shell have broken their profit record for a second quarter in a row as they reported adjusted earnings of $11.5 billion. This broke the record of $9.1 billion in the first quarter and beat analyst expectations of $11 billion. These earnings were also more than double of $5.5 billion recorded one year ago.
Shell also announced a $6 billion share buyback plan, which follows the previous $8.5 billion of buybacks that were completed in the first half of the year. Shell have left their dividend at $0.25 per share which is still far below the pre-pandemic level of $0.47 a share.
BP performance
BP reported replacement cost (RC) profits of $14.7 billion beating last year’s RC profits of $5.4 billion. BP will soon start a new $3.5 billion dollar share buyback scheme and shareholder dividend payments have increased by 10% to $0.11 per share.UK and Global Energy Sector Comparison
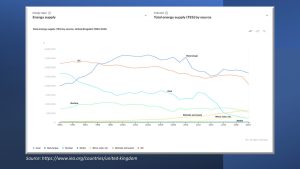
We can see from the charts that the UK supply of oil and coal have declined over time, in particular, gas supply reduced sharply between 2010 and 2014, and coal supply reduced sharply between 2012 and 2016. However, no other energy types sprung up to fill the gap in the market, with renewables such as wind and solar growing at a constant rate. Hydro power produces the smallest part of the energy supply and is growing at the slowest rate out of all the other energy sectors.
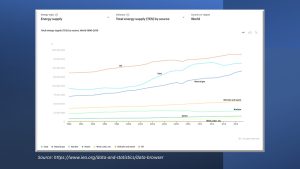
The world energy supply has grown at a steady rate. We can see that the 2008 crisis caused a dip in the supply of oil, coal and natural gas, after which coal was overpriced before correcting in 2016, whilst oil and natural gas continued production at the same rate. Nuclear power reduced in supply and only returned to 2010 levels in 2019. Solar and wind production are slowly catching up to hydro production levels.
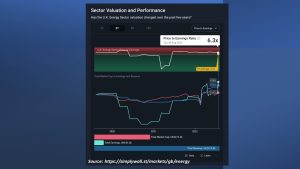
Energy Sector relative to the FTSE100
We can see that the UK earnings had dipped and were negative after 8 June 2020 and only became positive again around 9th July 2021. Although the trend looks like earnings will grow, analysts forecast that earnings will drop by 4.4% annually.
We can see that the 3 year chart for the FTSE100 and the total earnings of the UK energy sector are of a very similar shape, with both graphs dropping at the beginning of 2020 and then recovering in early 2021. This pattern is explained by the introduction of the first UK coronavirus lockdowns. During that time consumer demand and spending for oil reduced as people stayed at home instead of travelling.
Energy Sector Takeaways
We can see that in the UK energy sector, the use of non-renewable energy is decreasing, and renewables are steadily increasing in the sector. Perhaps there is an opportunity within the solar and wind market as the technologies are becoming more efficient every year. Currently, Big Oil companies such as Shell and BP are performing extremely well due to an absence of a windfall tax and increased energy price caps in the UK. The price of oil will remain high for the foreseeable future as demand has not kept up with supply. The reduction in natural gas supplied by Russia is already seriously affecting Europe, with the EU asking member countries in July to ration their energy. This is so the EU could save gas for the winter and avoid an energy crisis.Financial Sector Overview
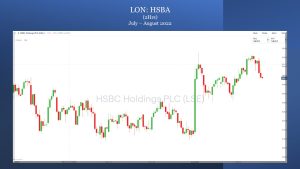
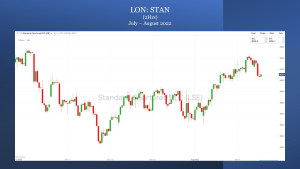
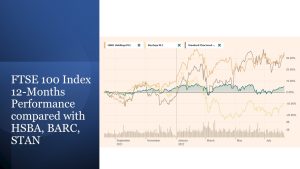
HSBC Holding Plc (HSBA), Barclays Plc (BARC) and Standard Chartered Plc (STAN) are international banking companies and are major constituents of the FTE 100 index.
Of the three, HSBC Holding Plc had the largest revenue last year £29.98B, with £13.92B net income. Followed by Barclays Plc, which had a revenue of £11.24B and £7.18B net income. Compared with these two larger financial groups, Standard Chartered is smaller in size with annual revenue of £8.49, net income £2.32B.
Recent Stock Movements and Earnings
For the past month, Barclays had the best stock price performance, with an increase of 9.46%, followed by the Standard Chartered Plc, 6.70%, whilst HSBC Holding Plc stock saw a rise of 5.39%. However, BARC had a notable drop on 28th July with the release of its interim report, as net income decreased 48% compared with the prior year.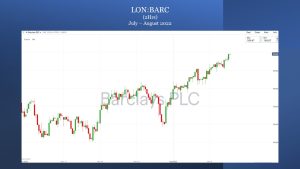 HSBC Holding Plc stock price saw a significant increase on 29th July. As they completed 86 million shares repurchase with the weighted average price 519.7P. After that, HSBC Holding Plc released its 2022 interim result, with a better-than-expected report.
 For the past month, Standard Chartered Plc, as displayed a strong rebound after a sell off, seen as corrective.
 These three FTSE 100 financial sector companies published their 2022 Interim financial reports during the last month, and broadly they have all seen an upward trend in their stock prices.
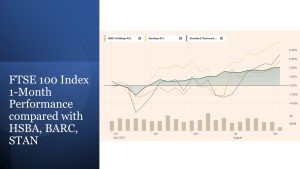
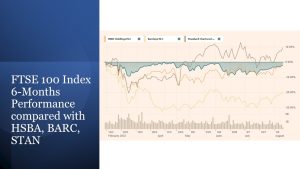
Financial Sector Relative Performance
Here we now compare the performance of the three FTSE 100 financial sector stocks with the FTSE 100 Index.
The below 3 charts show the performance comparison for the FTSE 100 Index and HSBA, BARC and STAN. Over a one month and 12-month basis, these financial sector stocks have mostly outperformed the index and apart from BARC have also preformed relatively well over the past 6 months.
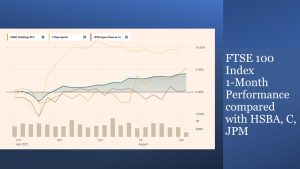
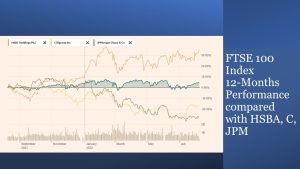
FTSE 100 Relative Performance To US Financial Groups
Below we look at the one month and one-year relative performance of the FTSE 100 compared to US financial sector giants, Citi Group (C) and JP Morgan (JPM).
Again, the FTSE 100 has performed relatively well more recently and over 12 months has been a particularly strong performer.
FTSE 100 Prospects For The Balance Of 2022 And Beyond
Given the positive outlooks for both the Financial and Energy sectors in the UK and given that these sectors make up a significant proportion of the FTSE 100 we see a bullish outlook for the wider index into August, for the balance of Q3 and into year-end.
From a technical analysis perspective the strong risk for Q3 (by September and even by August) we see threat for a test to 7695.5 and 7738.5 peaks from 2022 and 2019, with the year-end threat for a new record level above the May 2018 all-time high at 7903.7.
Author - Mr. Steve Miley Sr. Investment Advisor